Quick Links
Favorites
Customize ESPN


ESPN Sites


ESPN Apps


Follow live: Man City seek to close gap on Arsenal
TOP HEADLINES
GLOBAL SOCCER SCOREBOARD
SATURDAY'S GAMES
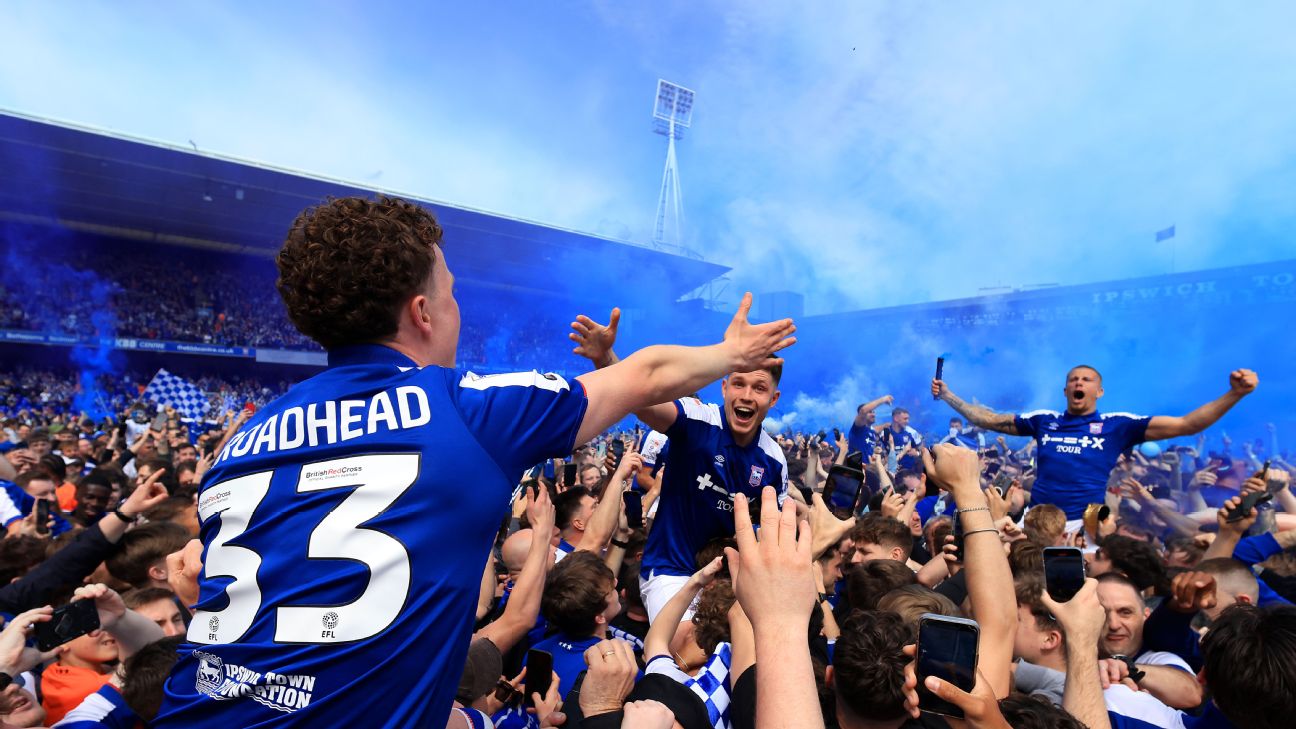
Ipswich Town celebrate remarkable promotion to Premier League
Ipswich Town were languishing in midtable in League One not so long ago. Now they are back in the Premier League - and the celebrations will last a long time.
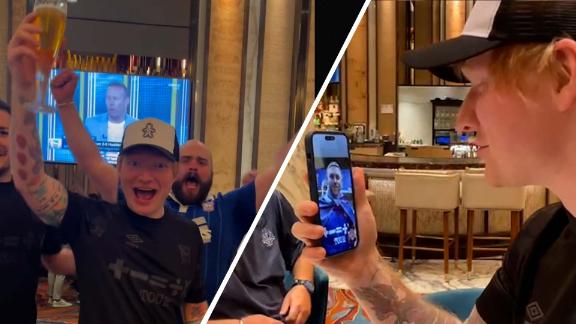
Ed Sheeran celebrates Ipswich's promotion
KEEP HIM OR DUMP HIM?
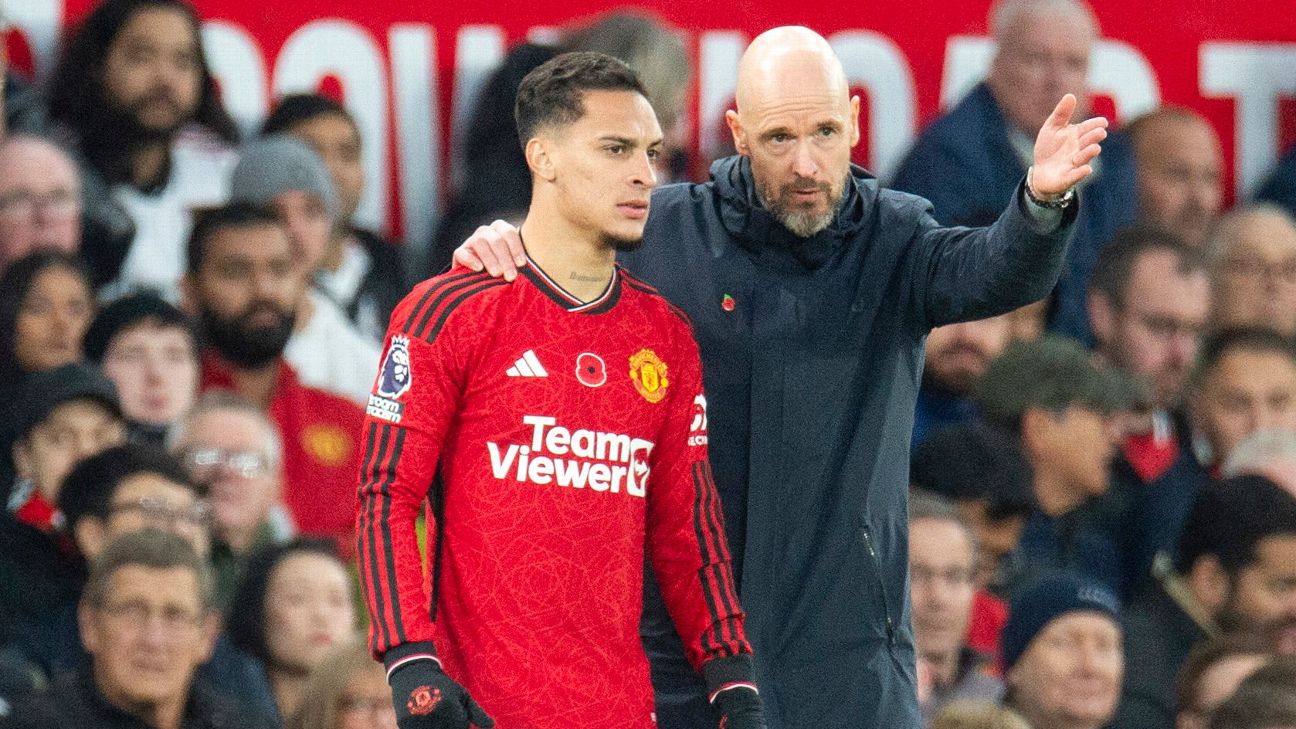
Should he stay or go? The case for, against Erik ten Hag at Man United
The debate about whether Ten Hag is the right man to lead Manchester United has grown in intensity as the 2023-24 season winds down, so let's break down the arguments on both sides.
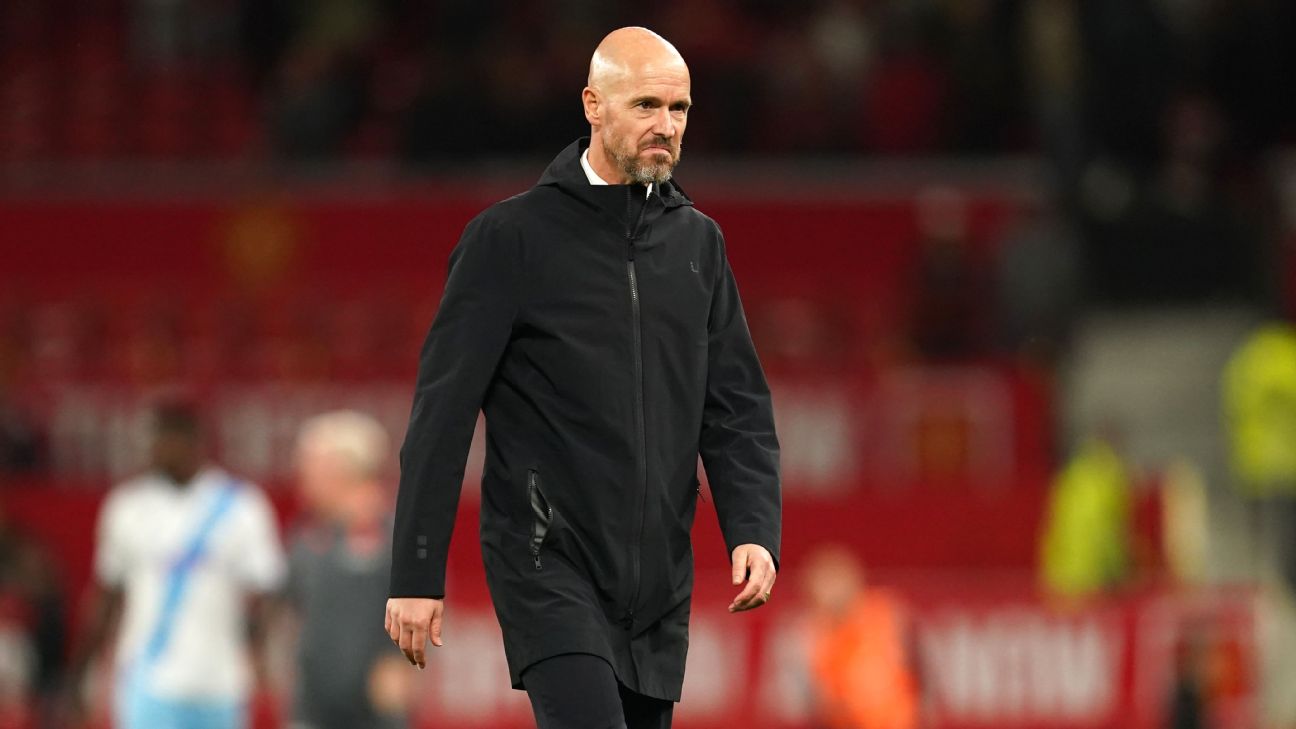
Reasons why Ten Hag will stay at Manchester United

MUNICH STUNNED BY STUTTGART
Stuttgart shock Bayern Munich in 3-1 win

Harry Kane scores from the penalty spot for Bayern Munich

DRIVING A TITLE CHARGE
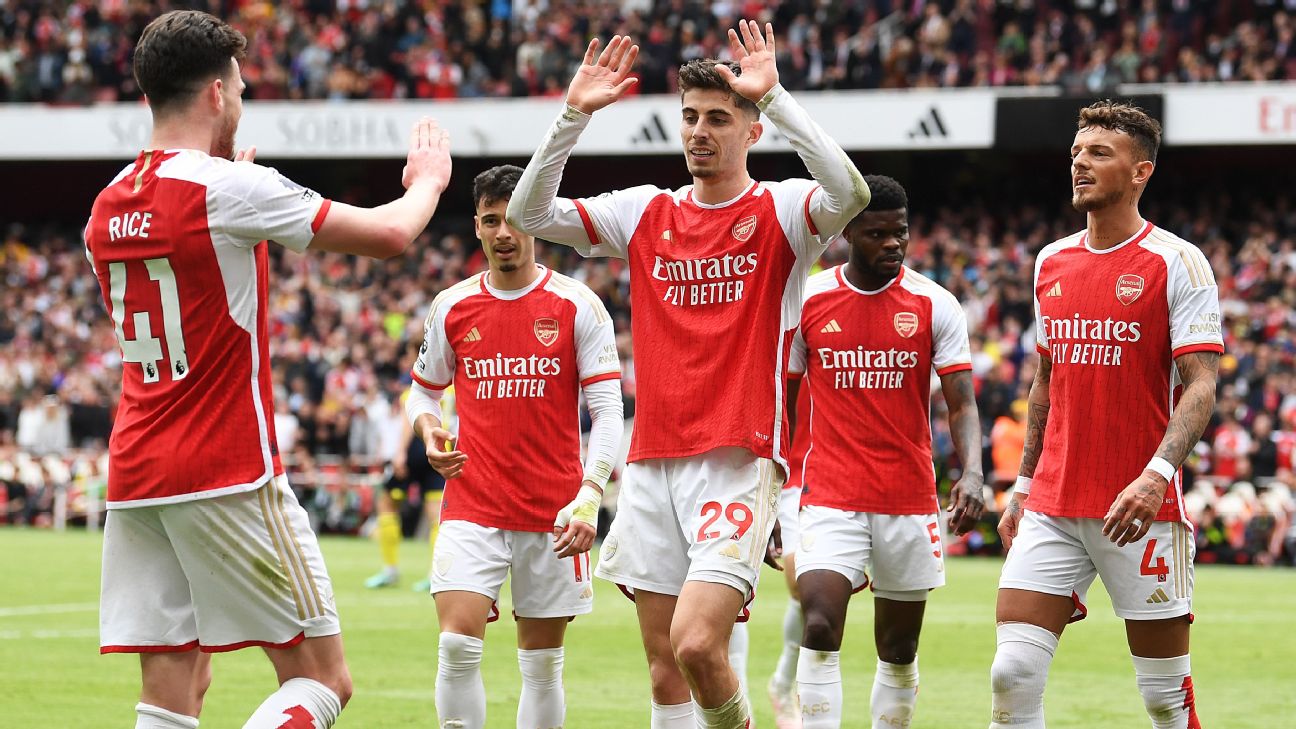
Havertz, Rice epitomize Arsenal's progress in Bournemouth win
Declan Rice got a goal and an assist, and Kai Havertz won a penalty, as Arsenal's summer signings continue to drive the title charge.
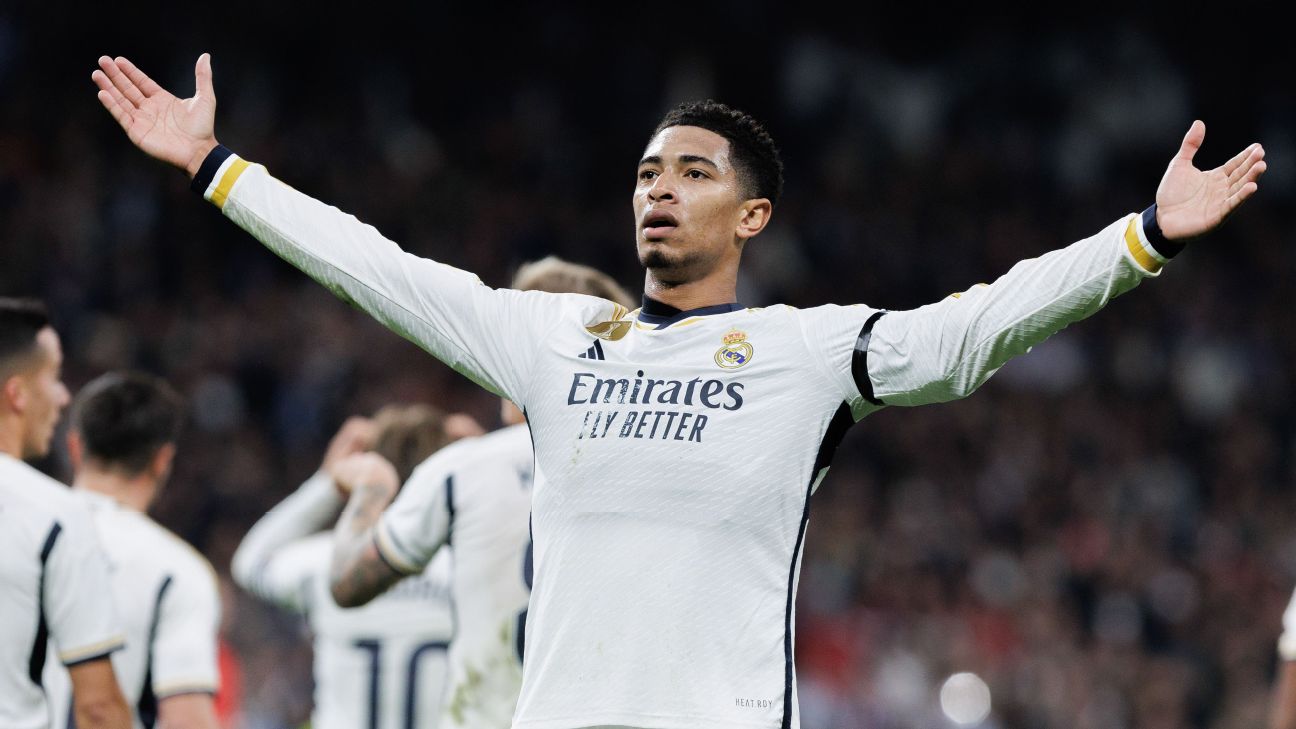
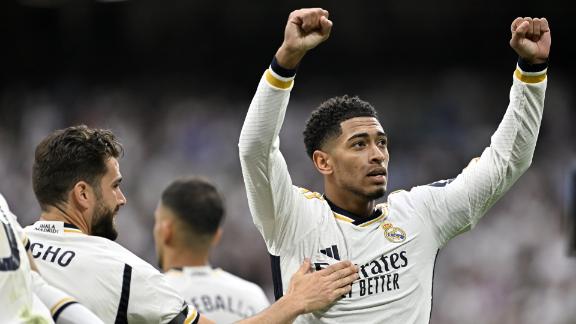
Real Madrid close in on LaLiga title with win vs. Cadiz

ASSESSING AMERICA'S BEST
Ranking the top 50 USMNT players on club form: ESPN's Player Performance Index returns
The USMNT Player Performance Index returns to rank the top 50 U.S. national team players and scientifically rate their club form.

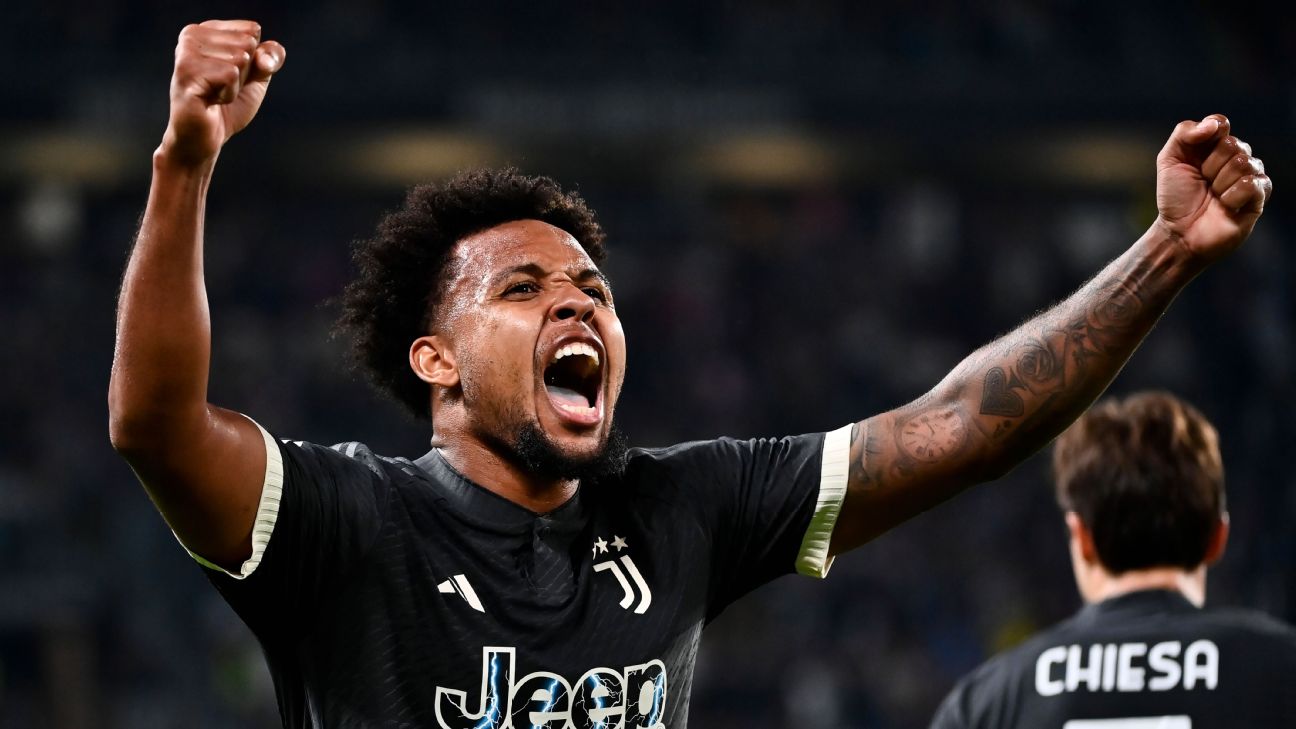
How McKennie became one of Serie A's best players
After a nightmarish spell in England, Weston McKennie has found form and confidence again at Juventus.
SOCCER TRANSFERS
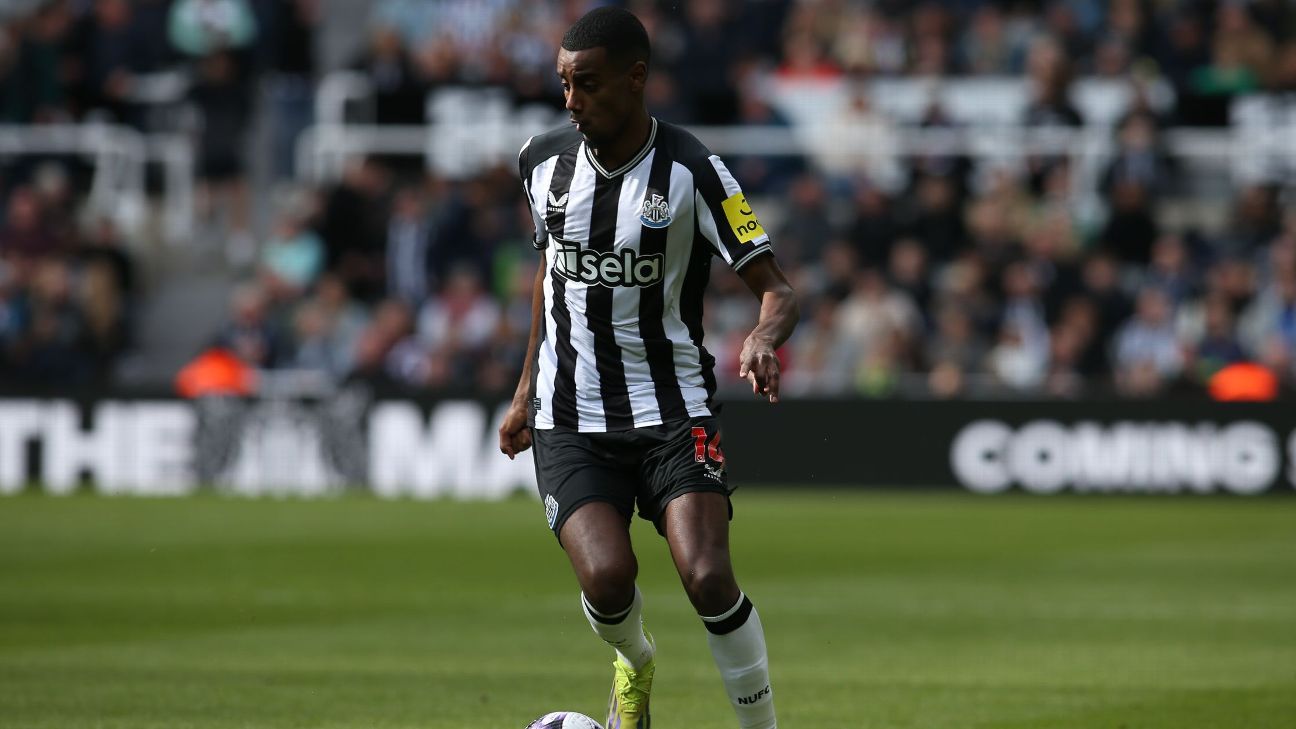
LIVE Transfer Talk: Arsenal have Isak on their summer wishlist
Arsenal are looking at Newcastle United's Alexander Isak as their main priority for the summer transfer window. Transfer Talk has the latest.
Top Headlines
- Madrid ease past Cádiz to edge closer to title
- Brady's Birmingham relegated from Championship
- 'Tastes like promotion': Sheeran hails Ipswich win
- Bayern slump to loss at Stuttgart as Madrid await
- Rice stars as Arsenal win to maintain PL title bid
- Ipswich win to complete shock promotion to Prem
- Outgoing Reus scores in Dortmund's UCL warm-up
- Martino: Miami not in position to sign Di María
- How Liverpool chose Slot as next coach
Best of ESPN+
- Peter Powell/EPA
Ranking all 16 Man United player signings under Erik ten Hag
Man United spent more on players than all but two clubs in the world under Ten Hag, but the team still isn't good. Let's go through all 16 signings to figure out why.
- JOSEP LAGO/AFP via Getty Images
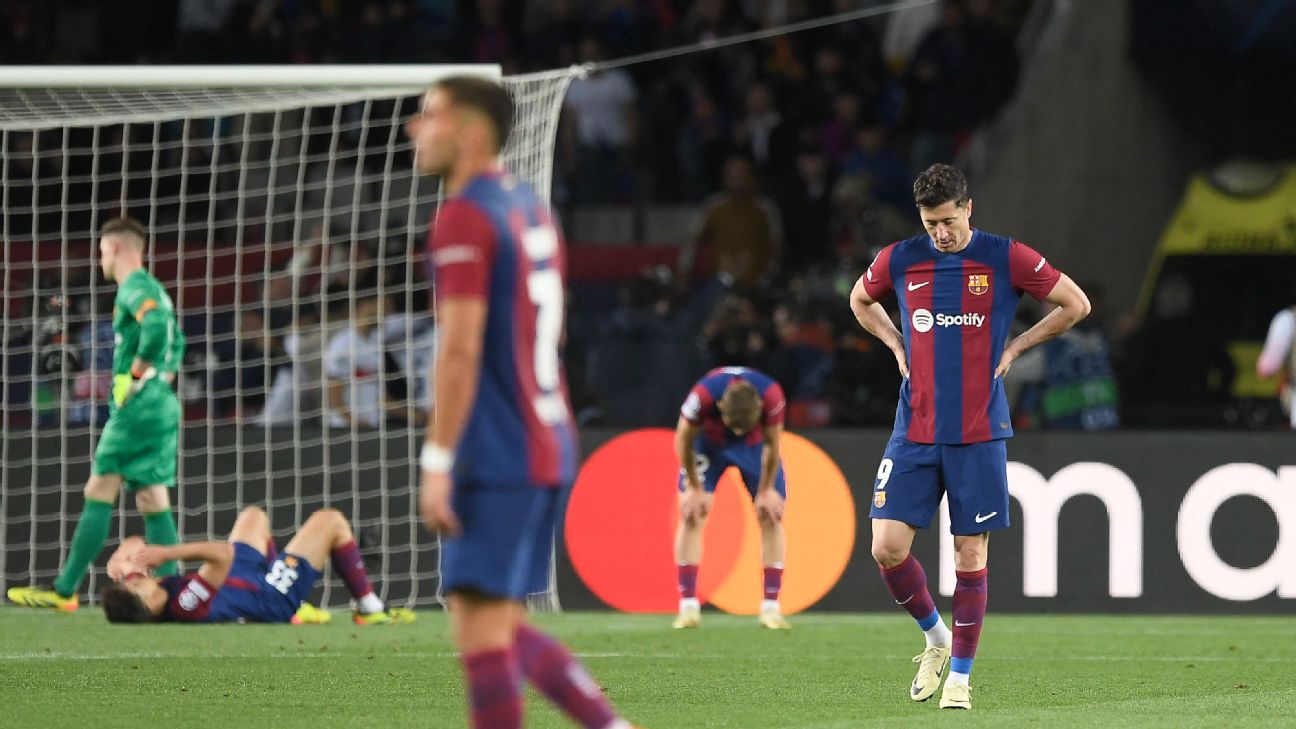
Can Barcelona ever close the gap to Clasico rivals, Real Madrid?
Last season, Barcelona won LaLiga over Real Madrid by a considerable margin; this season, the tables have turned dramatically. With Barca suddenly in crisis, what would it take for them to catch up?
Trending Now
- Colin McPherson/Corbis via Getty Images
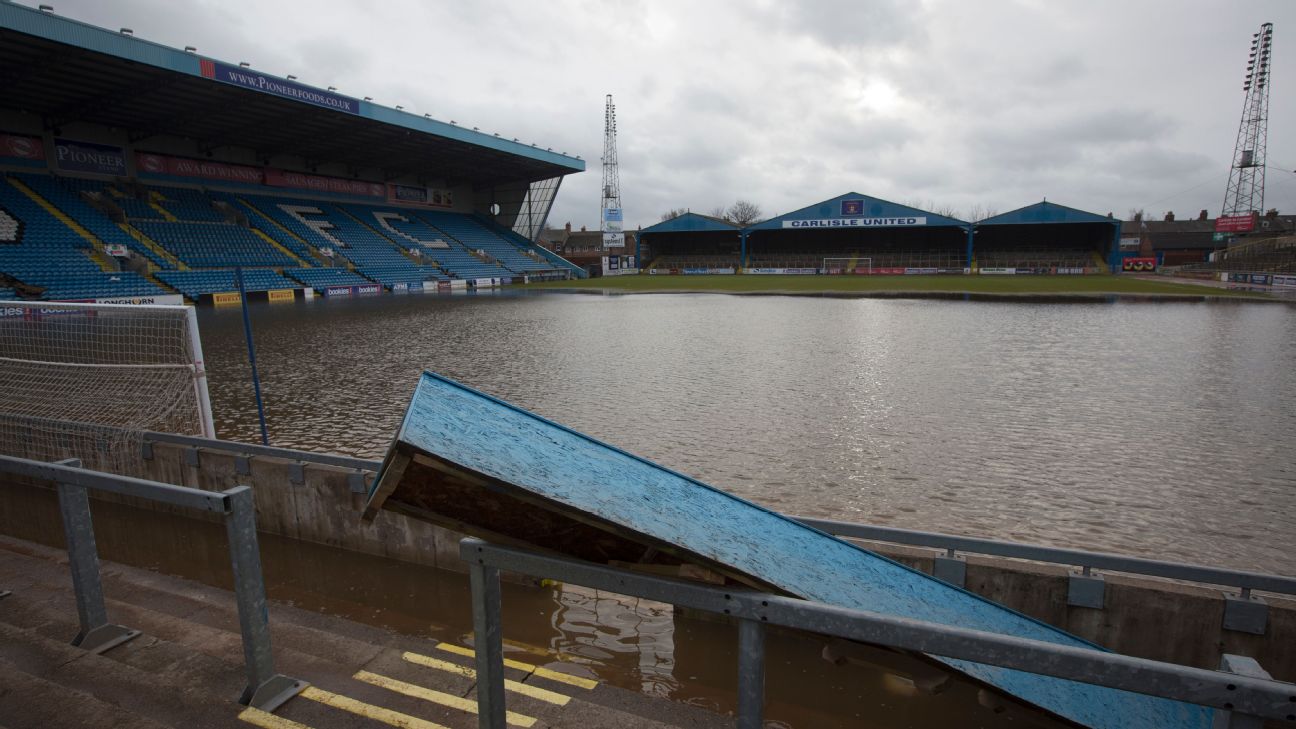
Football's climate change threat: Flooded stadiums, too hot to train
One in four stadiums in England are predicted to experience flooding by 2050. What is soccer's environmental impact and what can be done to reduce it?
- Donald Page/Getty Images
Messi tracker: Inter Miami games, goals, assists, more stats
Lionel Messi is in first full season with MLS side Inter Miami. Here's game-by-game analysis of how the World Cup winner is performing for his team.
Tables, fixtures and scores
- Photo by James Gill - Danehouse/Getty Images
League tables
Updated tables from the Premier League, Champions League, LaLiga, English Football League and more.
- Photo by Andrew Kearns - CameraSport via Getty Images
Upcoming fixtures
Keep track of all the important upcoming fixtures for all the clubs and countries in world football here.
- Guillermo Martinez/SOPA Images/LightRocket via Getty Images
Latest scores
Results and scores from the Premier League, Champions League, LaLiga, English Football League and more.